Your pprof is showing
IPv4 scans reveal exposed net/http/pprof endpoints
Golang’s net/http/pprof package is incredibly powerful: it’s trivial to debug a running production server. In the process it’s equally easy to accidentally expose your debugging information to the world. In this post we use the zmap project to show this is a real problem in the wild, and explain preventative measures you can take.
Update: an earlier version suggested an exposed endpoint could leak source code. Aram Hăvărneanu pointed out the mistake and this post has been corrected.
Introduction
With a single import _ "net/http/pprof" you can add profiling endpoints to a
HTTP server.
package main

import (
	"fmt"
	"log"
	"net/http"
	_ "net/http/pprof" // here be dragons
)

func main() {
	http.HandleFunc("/", func(w http.ResponseWriter, r *http.Request) {
		fmt.Fprintf(w, "Hello World!")
	})
	log.Fatal(http.ListenAndServe(":8080", nil))
}
This server will not only say “Hello World!” to you, it will also report diagnostics via /debug/pprof/.
- /debug/pprof/profile: 30-second CPU profile
- /debug/pprof/heap: heap profile
- /debug/pprof/goroutine?debug=1: all goroutines with stack traces
- /debug/pprof/trace: take a trace
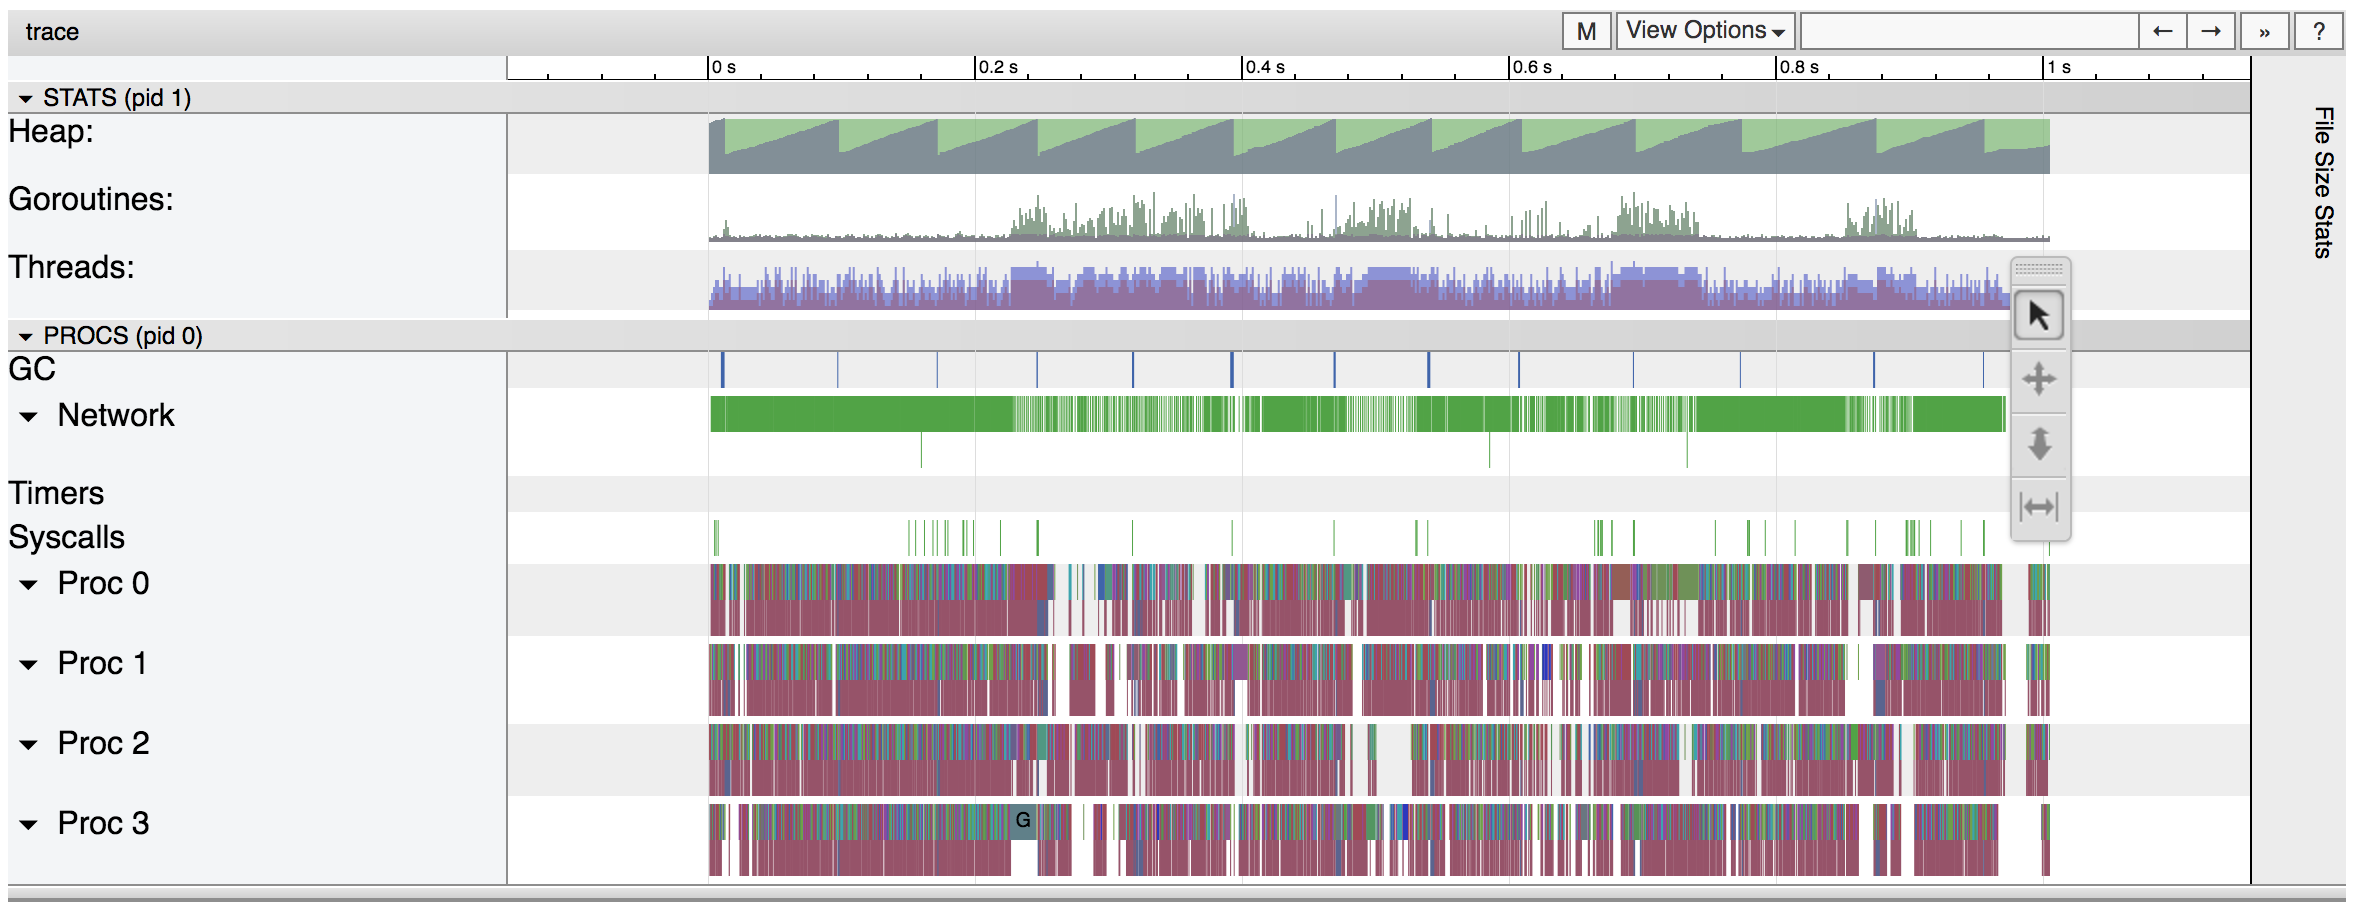
As an example, suppose we started this server and simulated some load with hey. Then we could inspect a trace with
$ wget -O trace.out http://localhost:8080/debug/pprof/trace
$ go tool trace trace.out
Within seconds we’re inspecting the server in fine-grained detail.
This feature is invaluable for tracking down bugs and performance issues that only manifest in production environments. However, with great power comes great responsibility.
Open Pprof Servers
This mechanism is dangerously simple. It only requires one import! The import could be anywhere. It could be tucked away in a library you’ve imported. In all the excitement of tracking down your goroutine leak, it slips your mind to remove the debugging. This begs the question:
How many pprof servers are open to the internet?
We can attempt to answer this question by scanning IPv4 for open pprof servers. To limit our search we could restrict to some reasonable port choices:
- 6060 suggested in official documentation
- 8080 appears often in tutorials
- 80 because it’s the standard HTTP port
- 443 for HTTPS
Firstly to disappoint you: I did not complete this search due to some threatening emails from cloud providers. No doubt I could have persevered with more devious methods, but I had already found sufficient evidence to convince myself that this is a real problem in the wild.
The zmap project makes these types of scans a one-liner.
$ zmap -p 6060 | zgrab --port 6060 --http="/debug/pprof/"
The zmap call scans IPv4 space for open 6060 ports. Then the “banner grabber” zgrab takes the results and issues a HTTP GET request for /debug/pprof/. We’ll consider any server that responds with “200 OK” and a body containing “goroutine” to be a hit. Here’s what we found:
- At least 69 IPs with pprof on port 6060
- At least 70 on 8080
- A handful on port 80 before Google Cloud suspended my account for “mining cryptocurrency”
OK so the cryptocurrency part is slightly bizarre, but I’ll take the hint. We’ve got a good few servers that have left this open to the world. I’m going call that a problem.
I have contacted owners of these services via emails in WHOIS data. I’d like to call out a remarkably prompt and proactive response from Linode.
I’d be interested to see someone with more knowledge complete these scans. I suspect there’s more to be found on ports 80 and 443.
Risks
Security issues:
- Function names and file paths are revealed.
- Profiling data may reveal business sensitive information (for example traffic to a web server)
- Profiling degrades performance, providing a vector for a DoS attack
Depending on your application, leaving a debugging server may not necessarily be a critical security hole. At a minimum it’s inadvisable, but it could be much worse.
Prevention
Farsight Security has already warned of this problem and offered excellent advice.
A simple and effective option is to put the pprof http server on a separate port on localhost, separate from the application http server.
In summary you need to arrange for two HTTP servers. A common setup would be:
- Application server exposed to the internet on
:80 - Pprof server on
localhost:6060only accessible locally.
The natural way to do this is to construct your main application without using global http methods (implicitly configuring http.DefaultServeMux). Then launch your pprof server in the standard way.
// Pprof server.
go func() {
	log.Fatal(http.ListenAndServe("localhost:8081", nil))
}()

// Application server.
mux := http.NewServeMux()
mux.HandleFunc("/", func(w http.ResponseWriter, r *http.Request) {
	fmt.Fprintf(w, "Hello World!")
})
log.Fatal(http.ListenAndServe(":8080", mux))
If for whatever reason you need to use the global http.DefaultServeMux for your application server, you can do a switch and then proceed as normal.
// Save pprof handlers first.
pprofMux := http.DefaultServeMux
http.DefaultServeMux = http.NewServeMux()

// Pprof server.
go func() {
	log.Fatal(http.ListenAndServe("localhost:8081", pprofMux))
}()

// Application server.
http.HandleFunc("/", func(w http.ResponseWriter, r *http.Request) {
	fmt.Fprintf(w, "Hello World!")
})
log.Fatal(http.ListenAndServe(":8080", nil))
I threw together the professor package to disarm the net/http/pprof package and provide some convenience methods.
// Pprof server.
professor.Launch("localhost:8081")

// Application server.
http.HandleFunc("/", func(w http.ResponseWriter, r *http.Request) {
	fmt.Fprintf(w, "Hello World!")
})
log.Fatal(http.ListenAndServe(":8080", nil))
Conclusion
net/http/pprof is awesome, just don’t leave your debugging information open to the world! Follow these precautions and you’ll be fine.
Discussion: hacker news, reddit, github issue, twitter.